
Essay
How You Can Embrace Constraints When Designing for Legacy UIs

Imagine you have to rebuild the whole flow in the most important part of a platform. Just as you start to brainstorm what the design could be, you receive a list of UI constraints and learn that you can rebuild only parts of the flow. Sound familiar?
That happened to our team when we had to rebuild one of the core functions of Marketing Cloud Intelligence (formerly Datorama). It was frustrating. But once we took the time to fully understand what we needed to achieve, we found we could work with the constraints by focusing on a few clear goals.
Understanding the core problem
As we changed our plans, we took inspiration from a different legacy product: the cassette tape. When cassette technology became widely available in the mid-1960s, manufacturers like Sony saw the potential and started building compact recorders and players. It wasn't until 1979 that Sony launched the first Walkman, which reached $150 million in sales by 1995. Sony embraced the cassette to make what co-founder Akio Morita called the "product that will satisfy those young people who want to listen to music all day. They'll take it everywhere with them... it'll be a hit."
The story reminded us that when we redesign a complex platform, we may not be able to change the technology or some well-loved features, but we can understand the core problem and design for it. As usability expert Jakob Nielsen recommends, it's smarter to evolve a UI with gentle changes than to offer a completely new design.
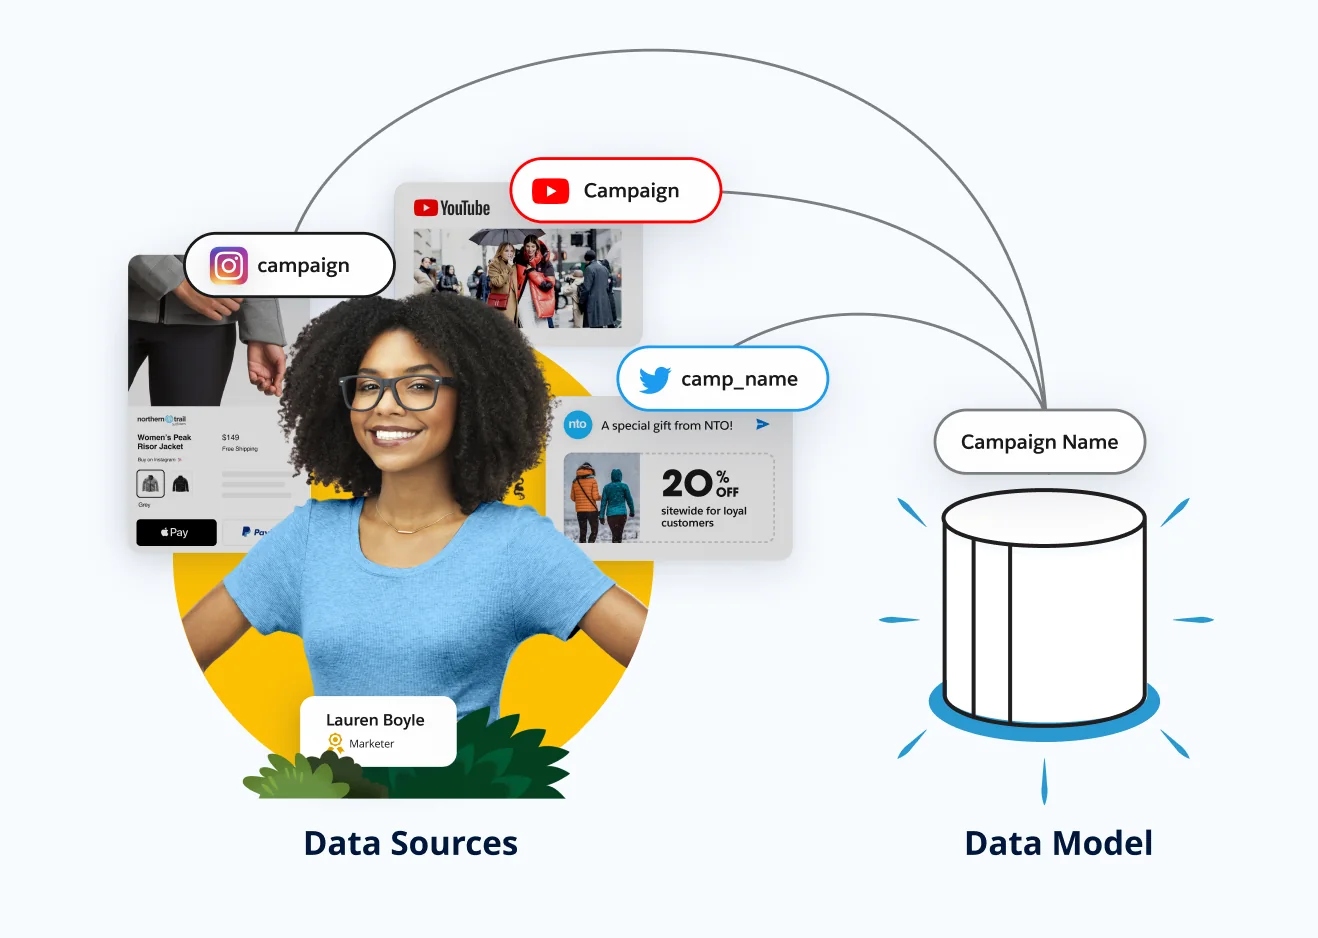
The purpose of mapping is to put information from many sources in one place, in the same language. We call that place the data model. Marketing Cloud users deal with complex data every day: there are over 8,000 marketing tools in the ecosystem, and analysts spend 64% of their time (5 hours a day) managing data. Given that, we chose to focus on two pain points:
- Reduce the time spent on data manipulation, and the errors it causes.
- Let people automate their data in the way that suits each dataset.
Here's what we did.
1. Streamlined the information
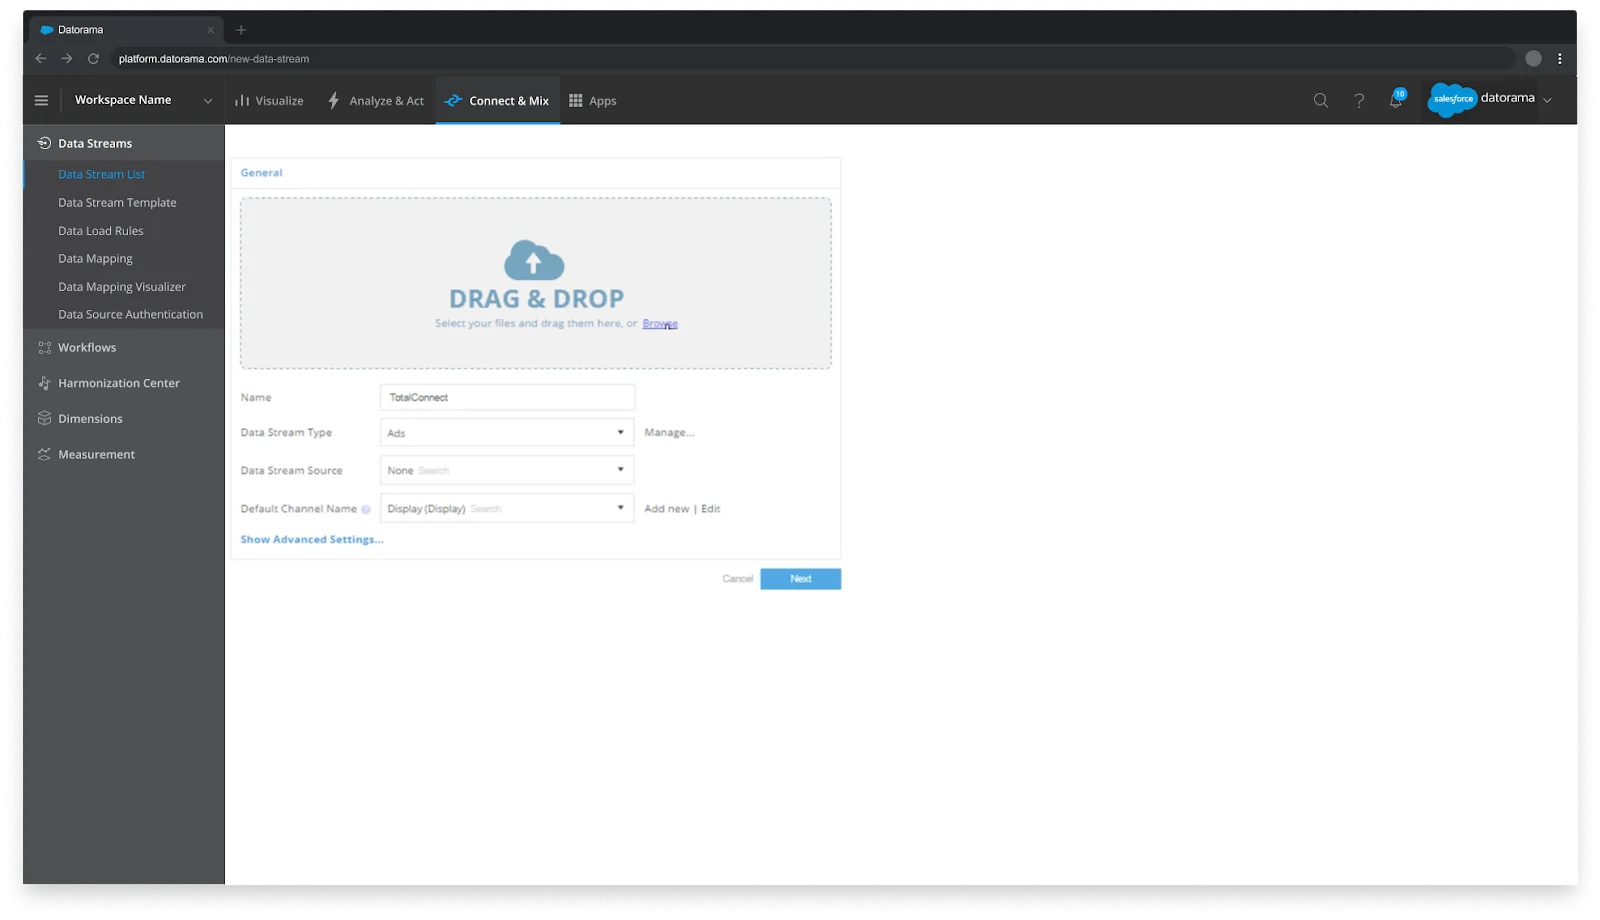
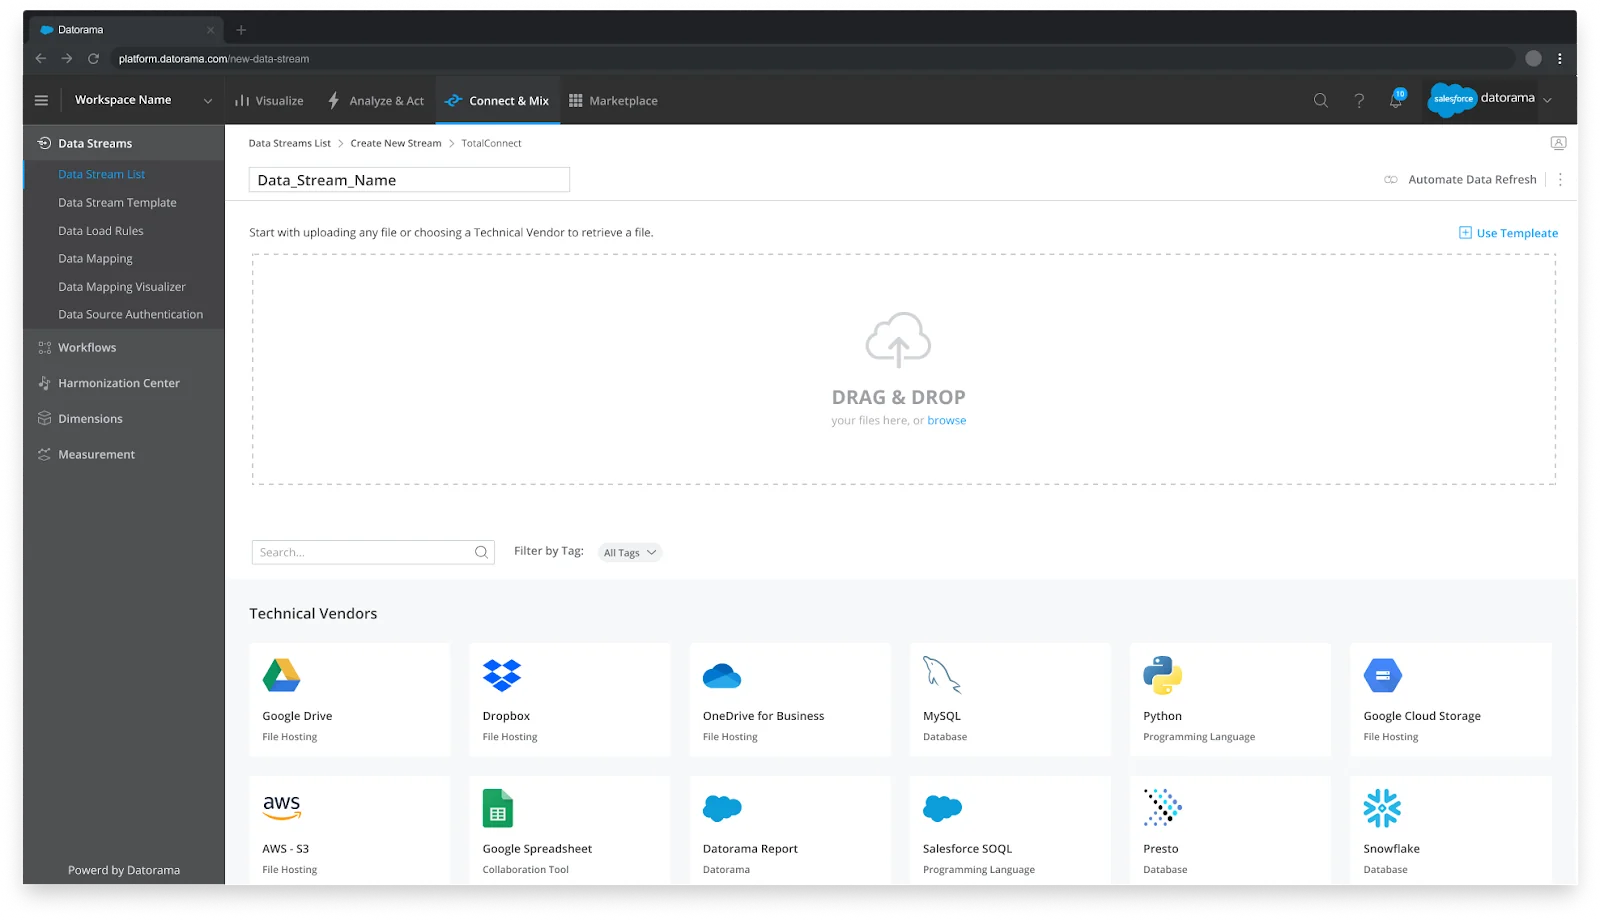
On the first screen of the flow, the user's goal is to upload their data or pick one of the technical vendors (a file host, a database, a flat file). We made it easier to act by removing or moving the steps that didn't need to be there.
2. Introduced a new UI
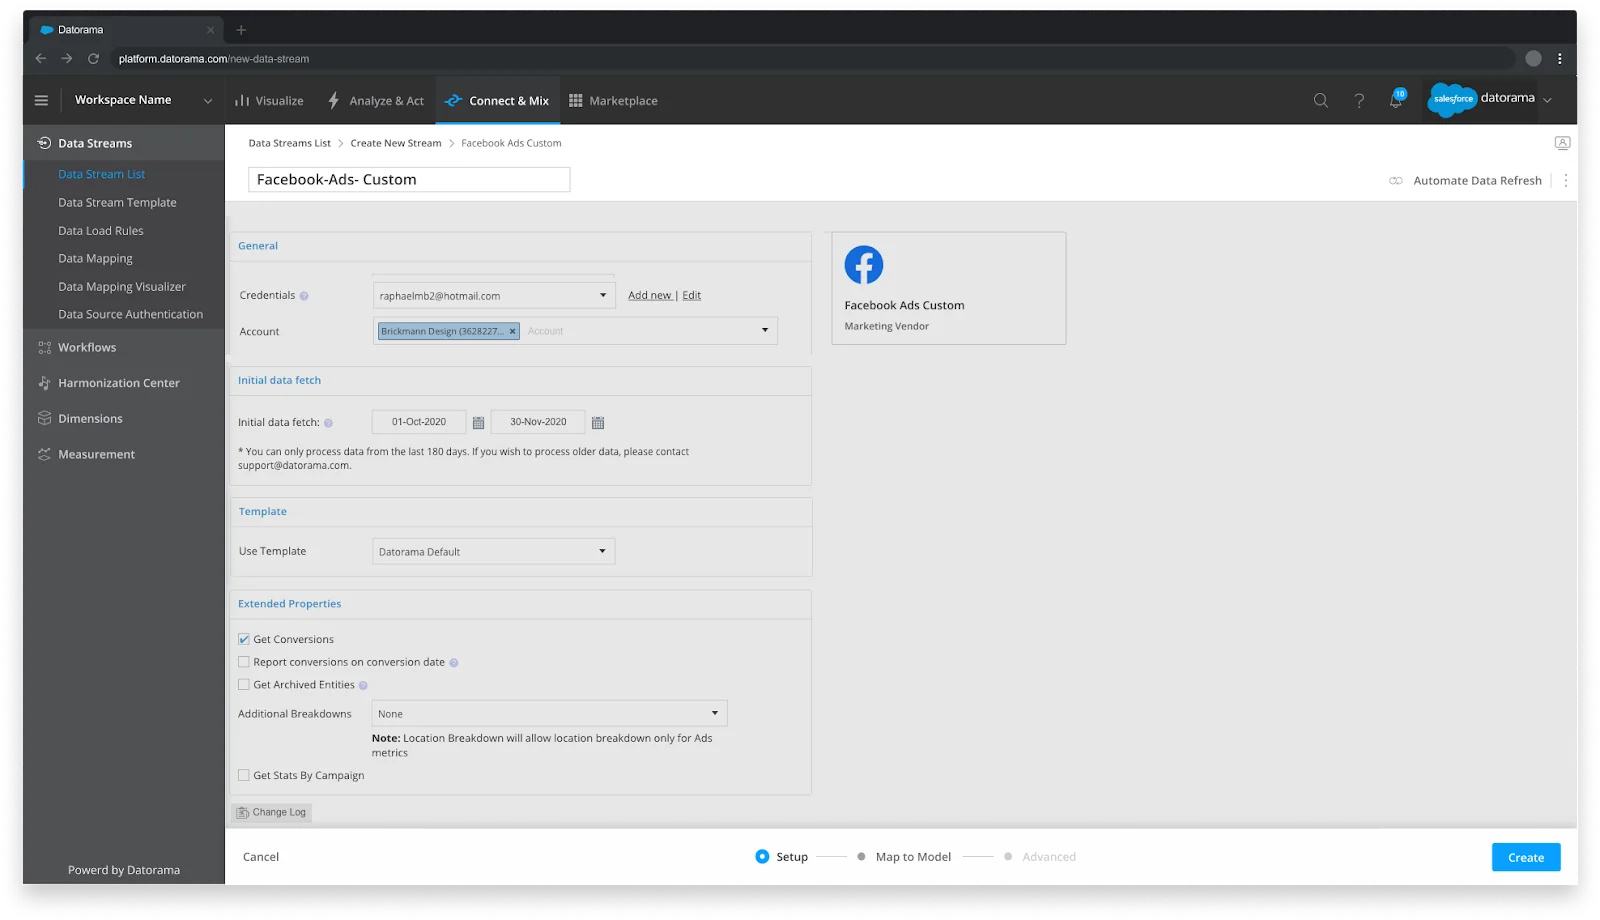
On the screens where we couldn't change the functionality, because of business concerns, development cost or the wish not to disrupt our users, we introduced new navigation instead. Breadcrumbs, a new header and a footer tie the old and the redesigned screens together, so people always know where they are.
3. Focused on the pain points
In a complex flow you have to focus on the issues that really need solving. It sounds obvious, but deciding what actually needs solving is what brings real value to the experience, the business and the product. So we designed for three things: helping people connect their data (data mapping), save time and make fewer mistakes (data validation), and stop doing it by hand (automated data refresh).
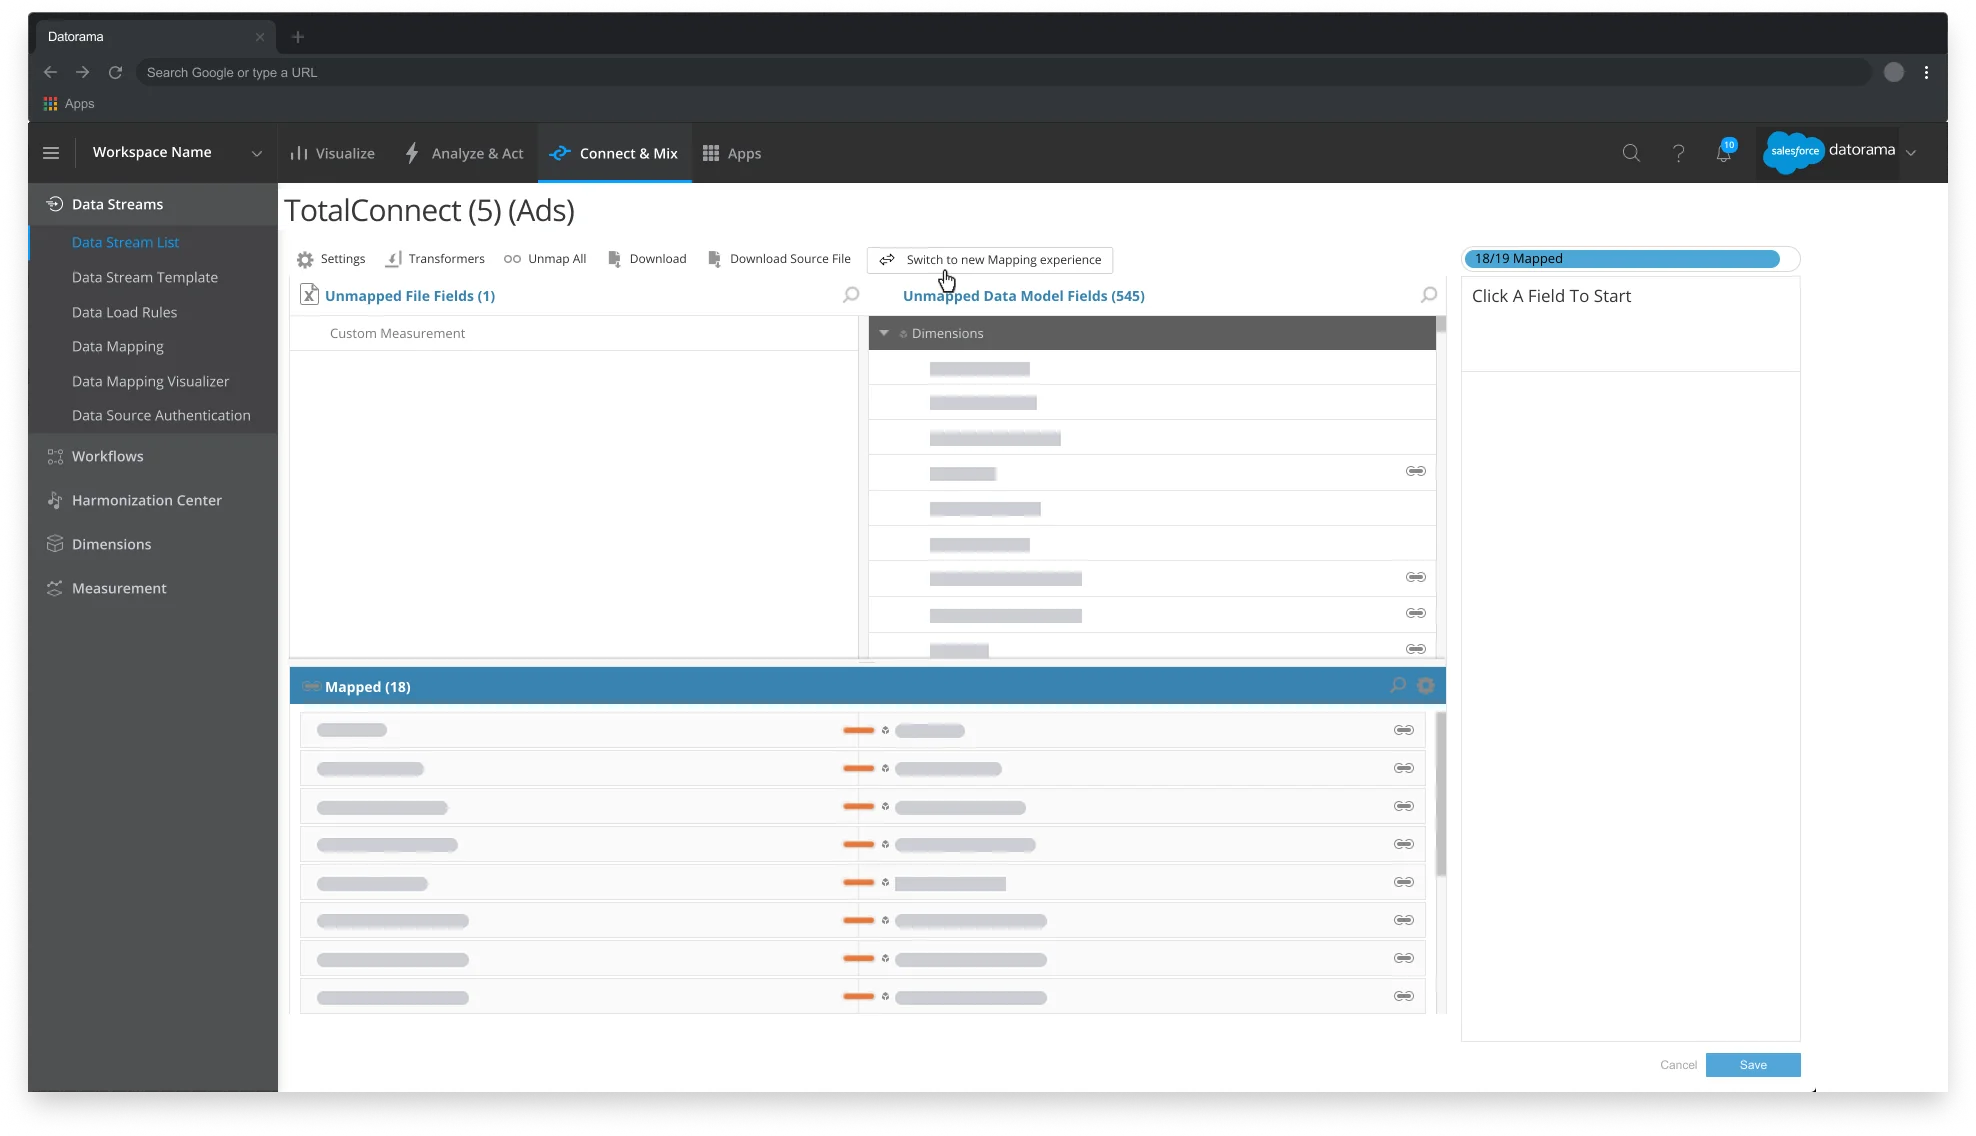
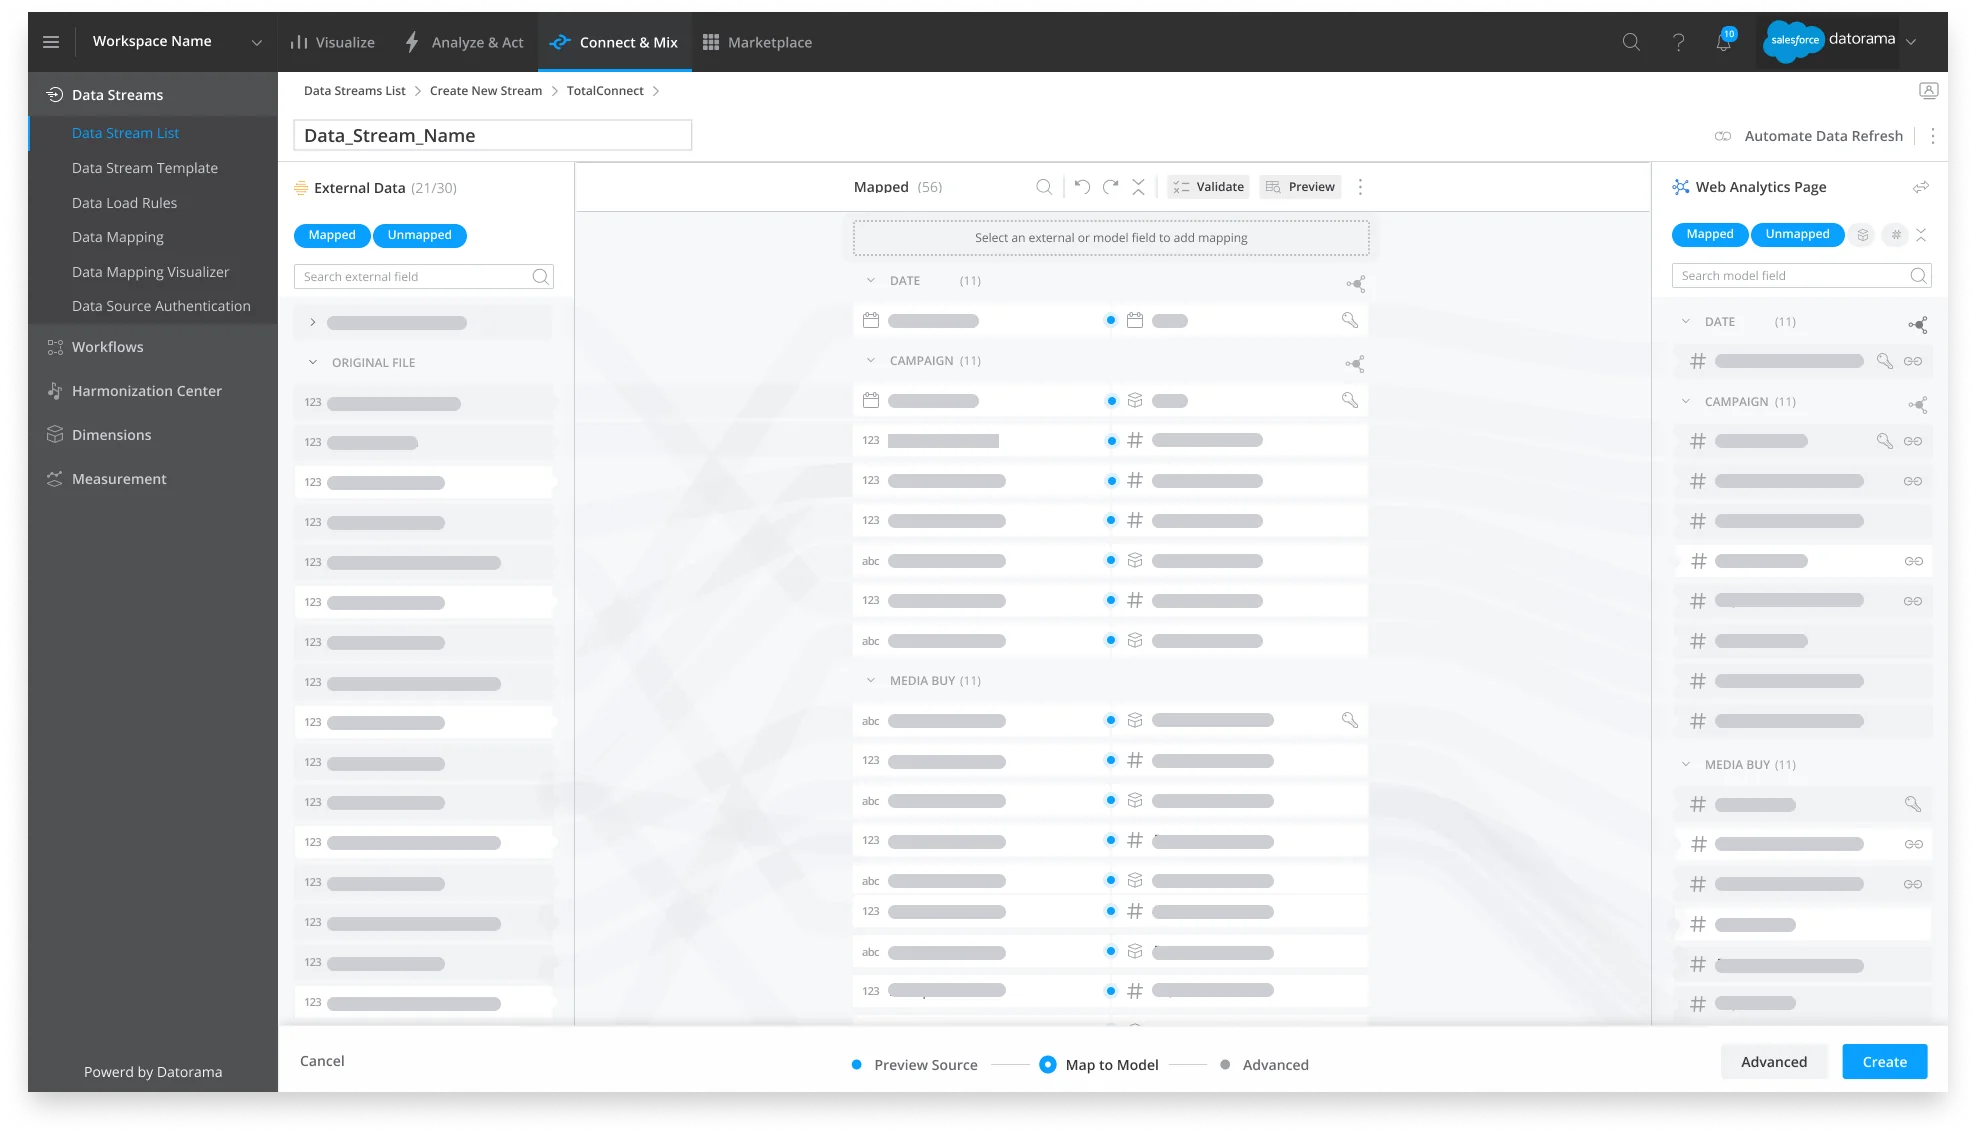
Data mapping. Mapping connects the source fields of the uploaded file, in the column on the left, to the matching Marketing Cloud Intelligence fields on the right. Machine learning suggests the mapping to start from.
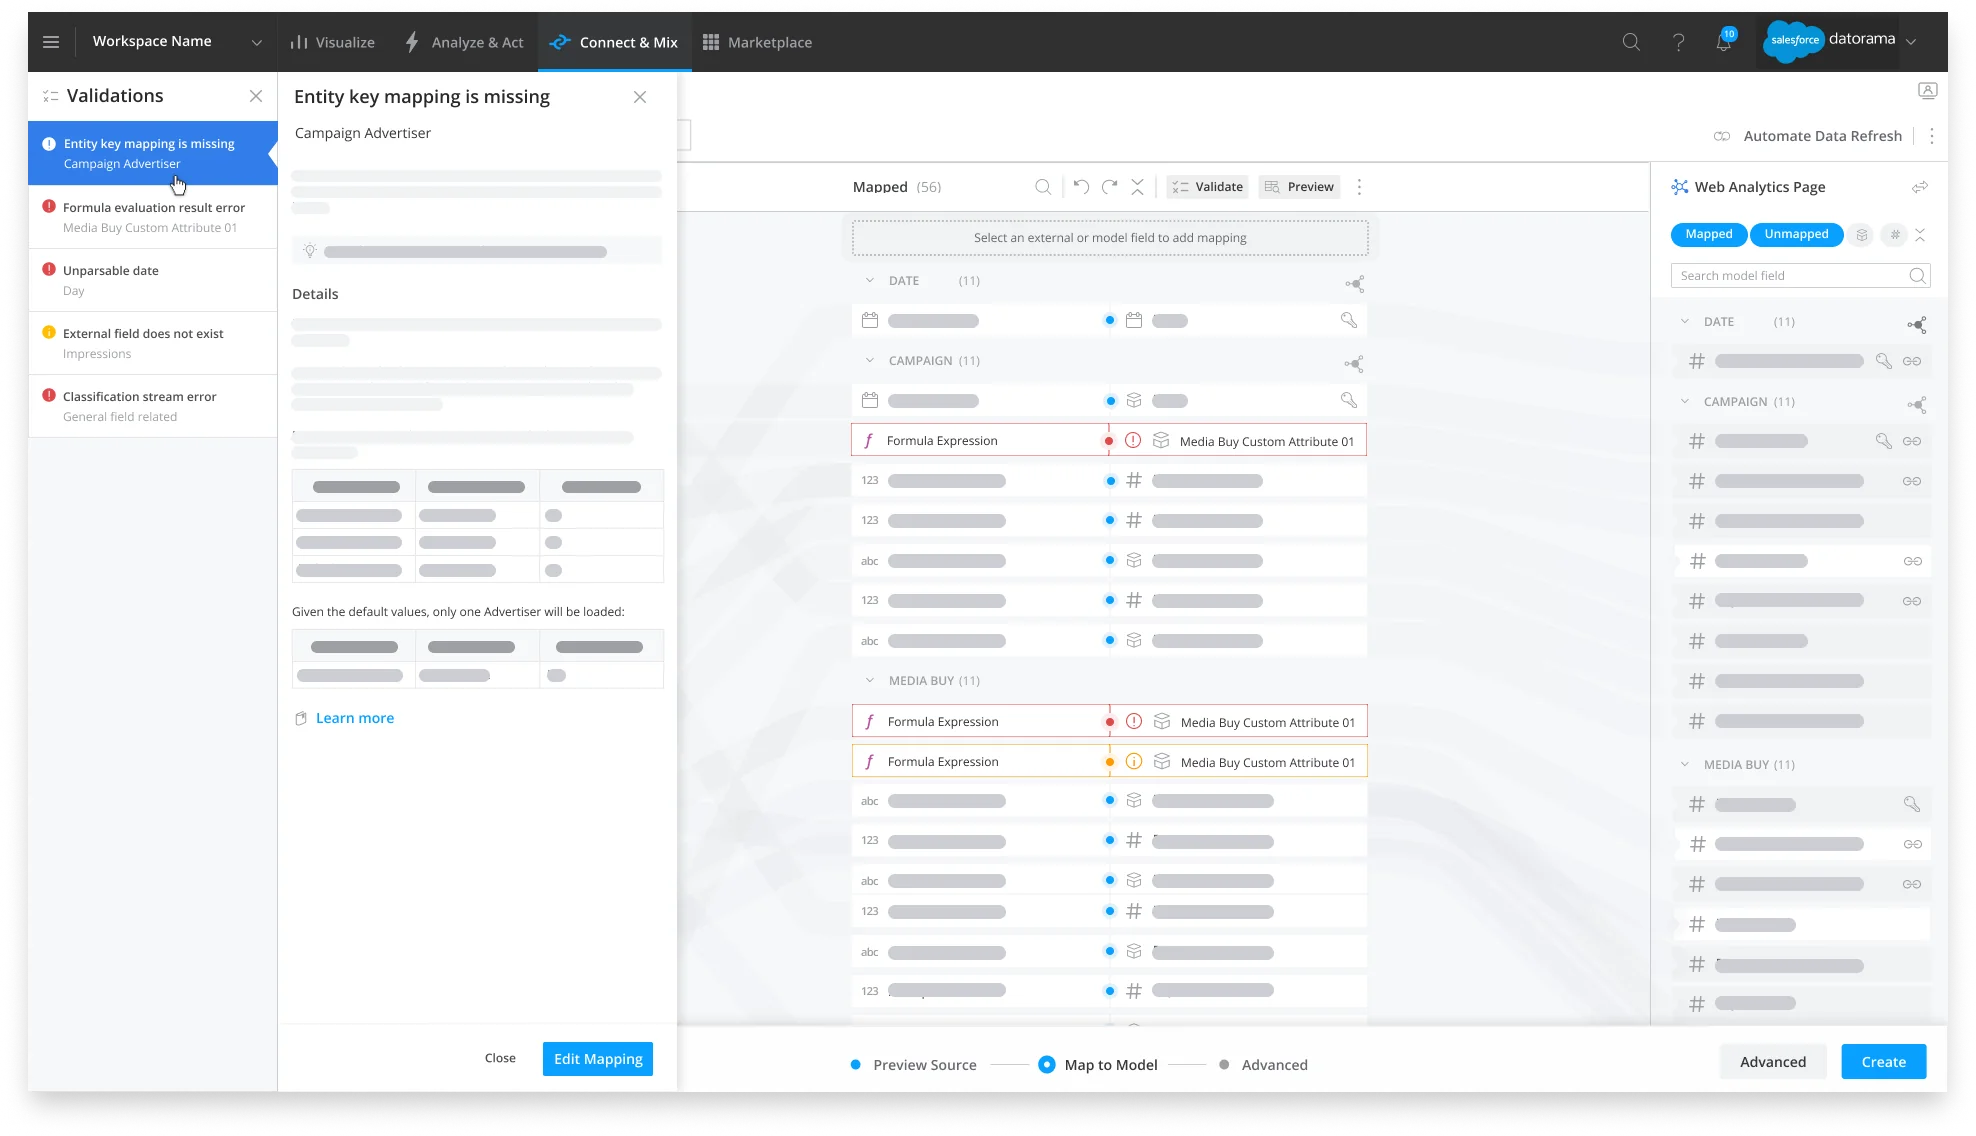
Data validation. Three kinds of message can appear: mapping errors, mapping warnings and model relationship errors. Errors are red and warnings are yellow, and all of them are listed in a Validations panel to the left of the mapping. Clicking a message explains it and shows how to fix it, like this mapping error saying an entity key mapping is missing:
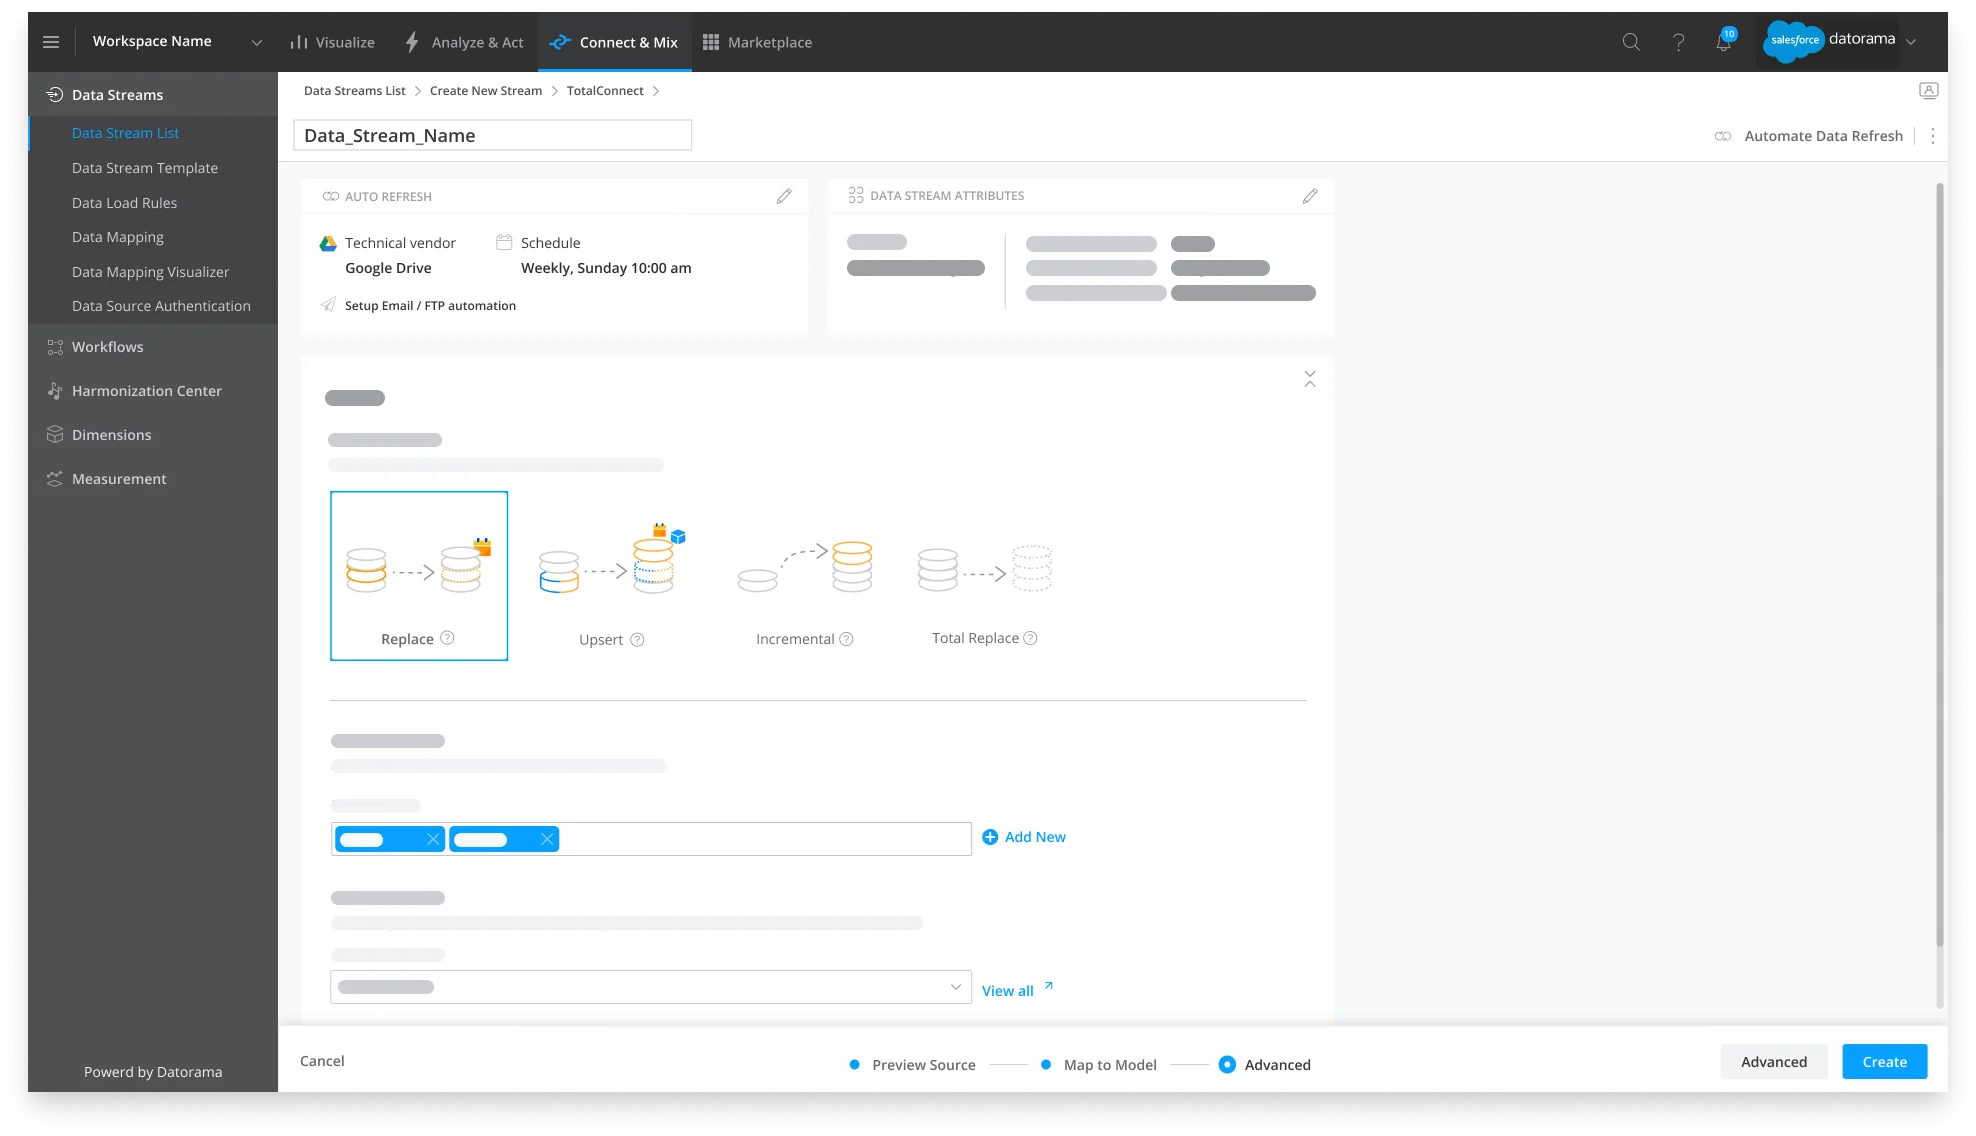
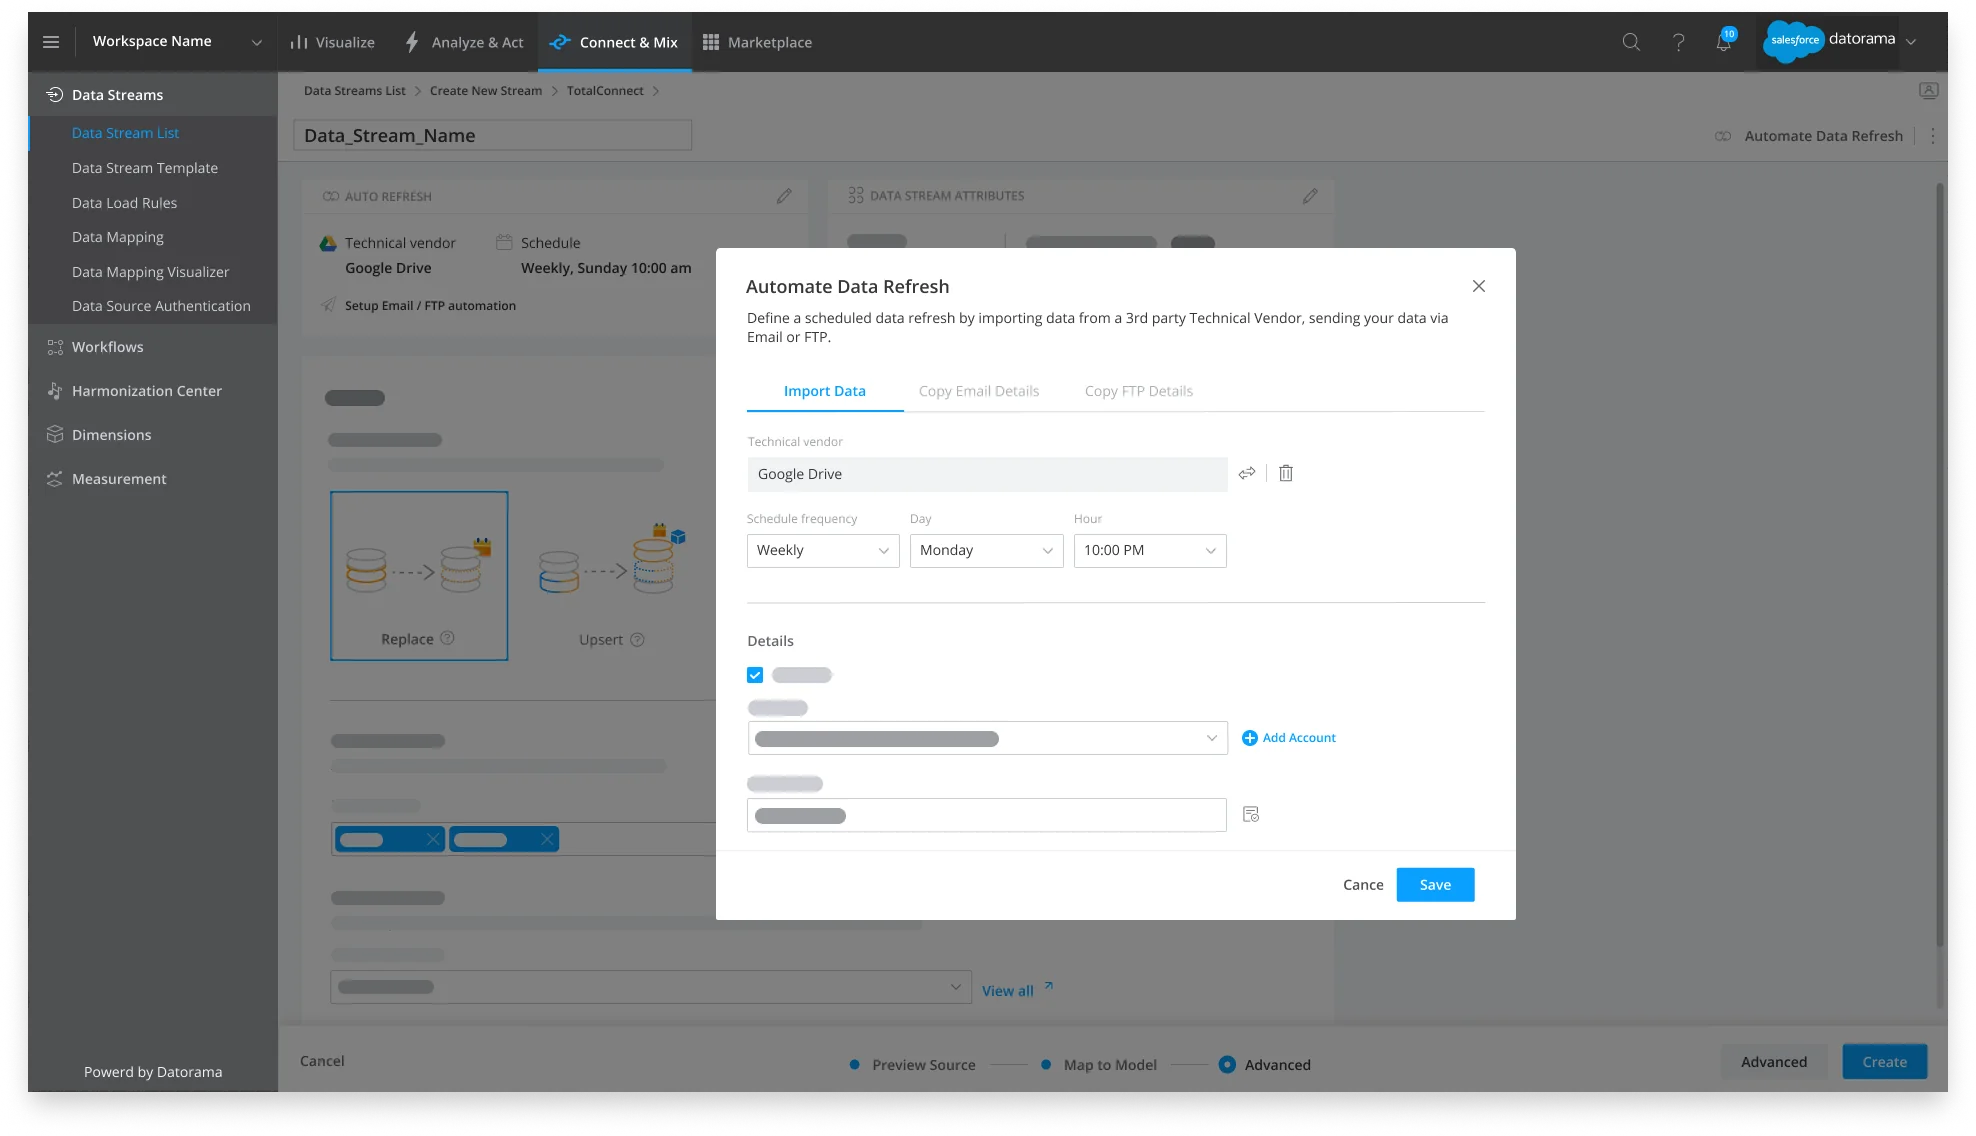
Data automation. Automatic data refresh imports data from a third-party vendor, or receives it by email or FTPS/SFTP, so nobody has to upload a file by hand each time new data arrives. People set the schedule and the other settings of the refresh from the Automate Data Refresh button at the top right of the data stream window, which stays there through the whole ingestion flow, or from the Edit icon in the advanced settings.
4. Analyzed performance
The strongest case for a product decision comes from putting analytics and qualitative research together. We listened to the feedback that came in through Slack channels and user interviews, but it was the analytics tool Amplitude that played the biggest part in shaping the feature, understanding behaviour and measuring each release.
To measure adoption, we could answer: How many people explore the new page? How many switch back to the legacy one?
To make the mapping page comfortable, we could answer: What are the most common screen sizes? Do people finish the mapping? What actions do they take along the way?
Constraints can be good
Legacy products come with their challenges, but constraints have a creative upside. They forced us to focus on what this redesign needed most. We practised gentle UI changes and gathered research and data along the way, which helped us influence the roadmap and made a complete redesign more likely in the future. That counts as a hit for us.
Thanks to my manager, Tamar Akavia (UX Director, Salesforce Intelligence), my mentor, Hrishikesh Deshmukh (UX Director, Salesforce Industries), and Hsiao-Ching Chou (Editorial Lead, Salesforce Design).
Sources: Gartner's 2020 Marketing Data and Analytics survey; Integrate and Analyze Marketing Data with Marketing Cloud Intelligence (Trailhead); the history of the Sony Walkman.
First published on Salesforce UX on Medium.
First published on Salesforce UX on Medium in November 2022, and lightly edited for the Lab.