
Tool
UX Analytics Overlay
The problem
Usage numbers for Semantic Layer Authoring lived in a Tableau workbook, customer feedback in Drive, and the list of tracked events in a spreadsheet. To answer "do people use this button, and does it work for them?" a designer opened three tools and matched event names to screens by memory.
See it in use
What it does
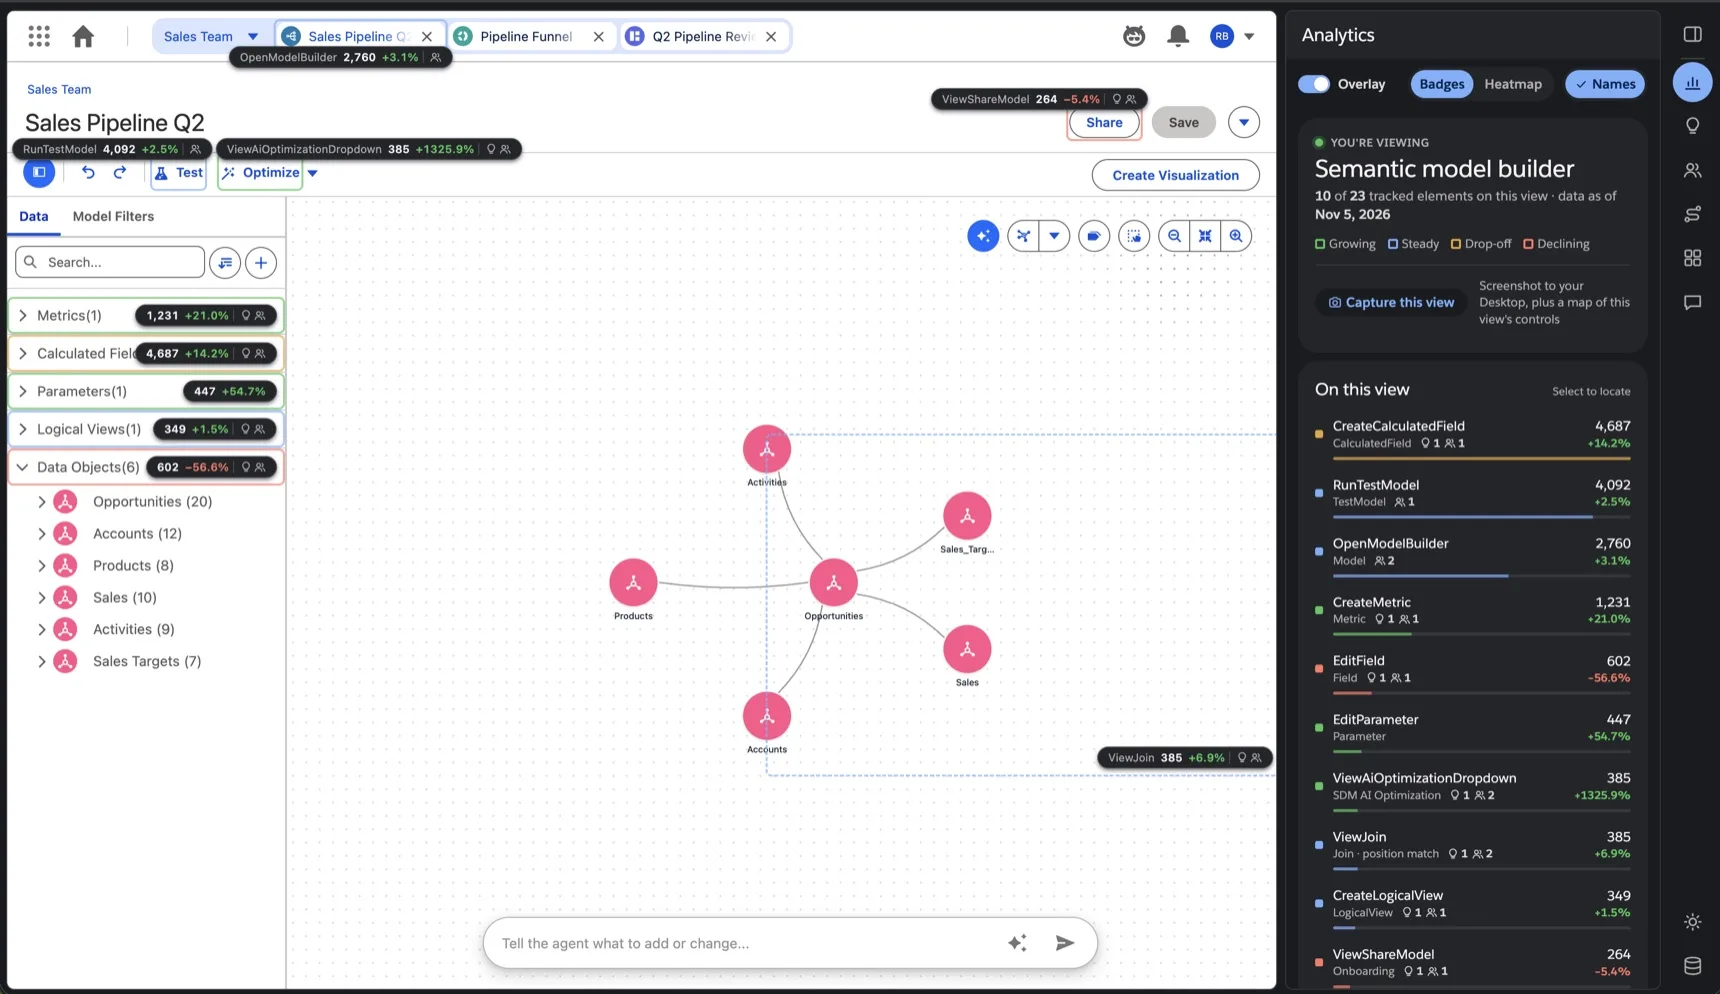
The overlay sits on the real product, the published prototypes or a signed-in org, and pins the data to the control it is about.
- Usage badges. Each tracked control gets a pill with its event, this month's count and the change on last month. A coloured ring says Growing, Steady, Drop-off or Declining.
- Hover for numbers, click for the story. A card opens on the control: how many people who open the model reach it, how many leave after it, and links to the insight and the customer theme about the same control.
- Heatmap. One cool to hot scale over the whole view, with each control's rank and share of the events on the page.
- User journeys. Every flow laid out as its screens, with the share of people taking each path and where they drop off. A weekly check captures the screens again and keeps each version.
- Customer feedback. Friction themes from interviews and tickets, each placed next to the usage of the same feature, so "a new metric goes nowhere" sits beside the numbers that show it.
- Dashboard. Adoption, retention, pathways and auto-written UX insights for the whole product, one click away from the overlay.
Everything sits in one panel beside the product. Point at a part of the model page below: it lifts off onto the sheet of analytics, and its column stands taller.
Usage badges
How often each control is used, and the trend, right on it.
Heatmap
See at a glance where people click and what they skip.
Insights
What the data shows, each with the next step to try.
User journeys
Every flow as its screens: where people go and where they leave.
Customer feedback
What customers say, pinned to the control they mean.
Dashboard
Adoption, retention and top accounts for the whole product.
Capture this view
A screenshot and a map of the view's controls, in one click.
Weekly checks
Journeys re-checked every week, with each version kept.
See it at work
Four scenes from the walkthrough. Each plays once and hands over to the next; pick a tile to jump to it.
System architecture & prompting
Almost all of it was built with Claude Code over five months: 75 of its 84 commits are co-written with Claude. Every number, insight and quote has a source you can open, and this is how it reaches the product.
1Sources
Tableau Cloud
- Product usage
- Adoption overview
- Usage insights
Google Drive and Sheets
- Customer feedback
- Event tracking sheet
This repo
- Pathways
- Element map
2Exports
JSON files
Each source is exported to its own file, with the date of its data.
npm run data:import3Overlay build
Joined on the element map
Each number is matched to the control it's about, so it lands right on it.
npm run overlay:data4Shown in
- Analytics
- Insights
- Customer feedback
- Dashboard
- Sources. Tableau Cloud views (product usage, adoption, insights), the event tracking sheet and customer feedback in Drive. Each is exported to its own JSON file with the date of its data.
- The element map. One hand-written file maps each control on the page to its analytics event. A build step joins every source on it, so each number lands on the control it is about.
- Four ways in. The product as a live screencast inside a normal browser (the default), a Chrome extension docked beside it, a framed copy through a local proxy, or Chromium with the panel docked on it. The Variant Switcher flips between them, so the team could compare the four in use before picking one.
- Capture this view. One click saves a screenshot and an outline of the controls on screen (never field values), which is what new mappings are written from.
- Feedback on the tool itself. "Report wrong element" lets anyone point at a badge on the wrong control and send a note, so the map gets fixed by the people using it.
Failure modes / edge cases
- Not every number is live. Pathways are not in the Tableau views, so that chart and the insights drawn from it are modelled, and the panel says so. Filters with no breakdown in the data say that too, instead of pretending to filter.
- Controls move. A badge finds its control by selector (looking inside the components' shadow roots), then by tag and text, then by a stored position drawn with a dashed ring. Badges follow scrolls inside panels, which never reach the window.
- Sign-in can't be proxied. An org session won't pass through a proxy, so org links open in a Chromium window with a saved profile instead. Managed Chrome blocks unpacked extensions, so the extension is preloaded there.
- The screencast has limits. Input-method typing and dragging files in are not forwarded, and Chromium only accepts the overlay's own origin.
- Refresh needs a person. Tableau and Drive need a sign-in, so Refresh rebuilds from the latest exports rather than pulling them.
- Feedback can hold personal data. Quotes and recordings stay in the panel and are never shown in badges or captures.
It runs on internal product data, so there is no public demo: the peel at the top, the film and the clips above show it on the prototype.