Salesforce Intelligence
InteractionSalesforce Intelligence
The problem
Today, marketers are responsible for more than just reaching their customers. They need to be certain they’re driving a return on all their investments. They have over 8,000 marketing tools within the ecosystem, and 64% of analysts’ time (5 hours/day) is spent managing the data. Given that context, we decided to focus on solving two main pain points:
- Reduce the amount of time and errors related to data manipulation.
- Add the ability to automate data according to what’s best for the dataset.
The challenge
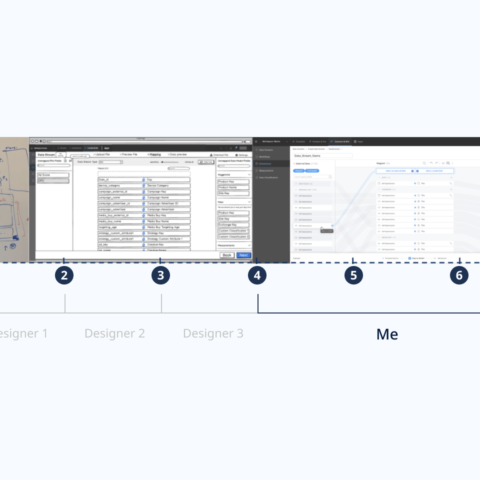
When I joined Salesforce in 2020, I jump into a project in which I must rebuild the entire flow of an essential part of a platform that three designers had previously contributed to. After brainstorming about the design possibilities, we learn there are UI constraints and that only parts of the flow can be rebuilt. The beginning was frustrating. However, after analyzing what needed to be accomplished, we realized that focusing on three goals would allow us to overcome the constraints.
- Streamlined information
- Introduced a new UI
- Focused on pain points
UX Work Process
1 – Planing with the PM
2- Research
3- Initial Design
4- User Testing
5- Final Design and Developing
6 – Release
7- Analyse
1. Streamlined information
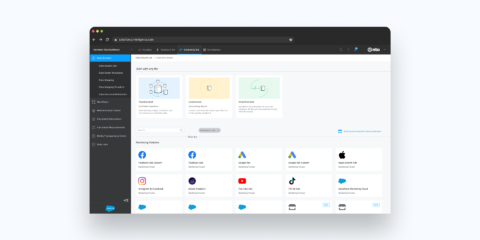
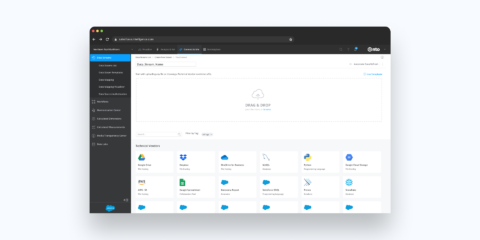
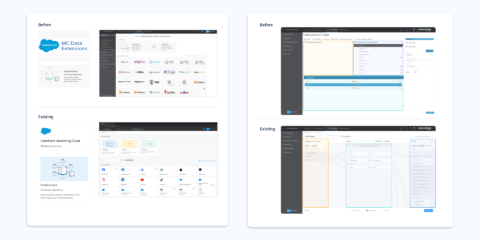
In the first screen of the flow, the user’s goal is to upload their data or select one of the technical vendors (file host, database, flat file). We made it easier for the user to take action by eliminating or relocating unnecessary steps.
2. Introduced a new UI
For those screens where we couldn’t change the functionality — due to business concerns, development requirements, or wanting to minimize disruption to our users — we introduced new UI navigation instead. We created a more cohesive relationship between the old and redesigned screens in our platform by adding breadcrumbs, a new header, and a footer to help the user navigate.
3. Focused on pain points
When we’re dealing with complex flows, we always need to focus on the main issues that need solutions. This may seem obvious, but deciding what actually needs solving helps to bring real value for the user experience, business goals, and product impact. With that in mind, we came up with solutions for enabling users to better connect their data (data manipulation), save time and make fewer errors (data validation). We also automated it (automate data refresh).
Data mapping
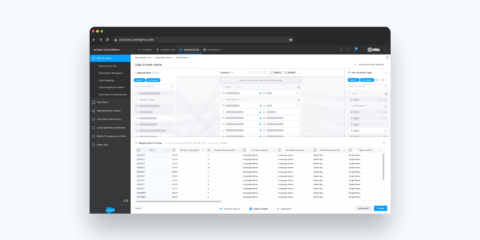
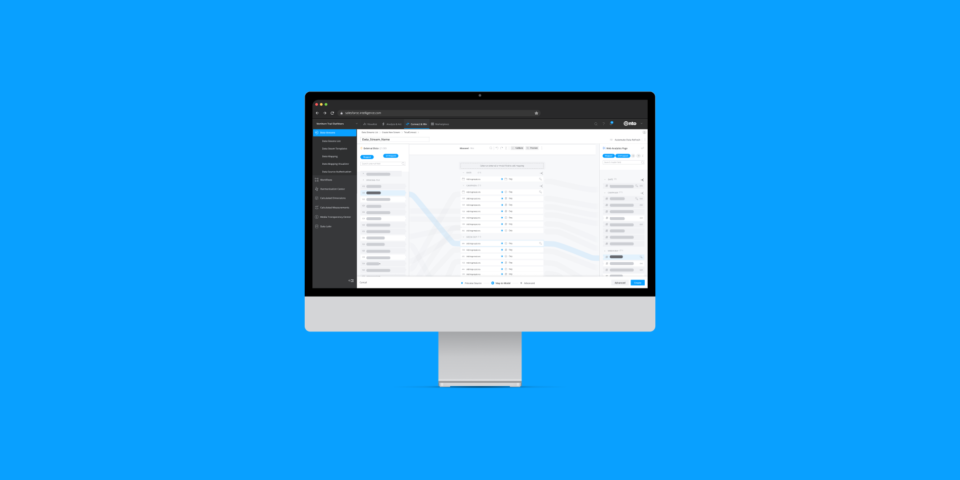
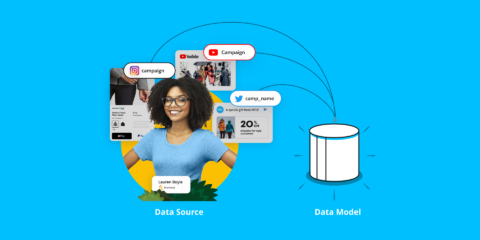
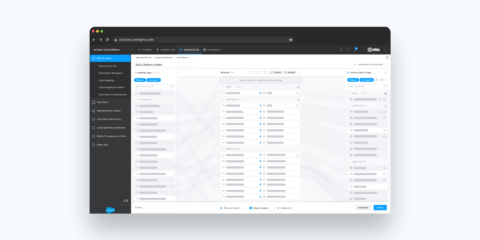
Mapping connects the source fields in your uploaded file on the column left to the corresponding Marketing Cloud Intelligence (Datorama) fields on the column right. Marketing Cloud Intelligence uses machine learning algorithms to map your data.
Data validation
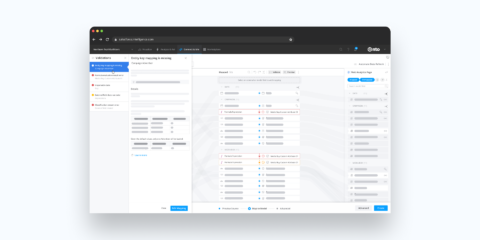
Three validation messages can appear during validation: mapping errors, mapping warnings, and model relationship errors. Errors are in red and warnings are in yellow. The user can see each of these messages in the pop-up on the left of your mapping under Validations.
To get more information and see how to fix an error, the user can click the error on the left side. Here’s an example of a mapping error indicating that an entity key mapping is missing:
Data automation
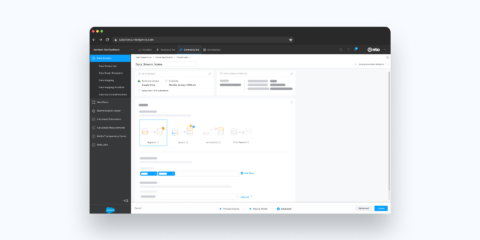
The user can use automatic data refresh to import data from a third-party technical vendor or to have data sent automatically via email or FTPS/SFTP. Automatic data refresh allows you to avoid uploading your data manually each time new data must be ingested into the data stream. Using automatic data refresh the user configures their schedule frequency and other settings related to their data refresh automation. The user can click the Automate Data Refresh button at the top-right corner of the Data Stream window, which appears throughout the entire data ingestion process. Or when defining or editing advanced settings, click the Edit icon.
4. Analyzed performance
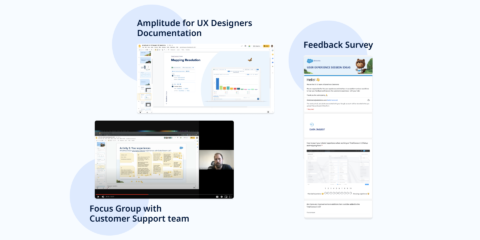
The strongest argument for influencing product decisions comes from quantitative research analytics and qualitative research. In our case, we had Open discussions with the design team, and feedback from clients and the customer support team was collected through Workshops, Google Forms, and Slack channels. . But it was the analytic tool Amplitude that played an essential role in designing the new feature, identifying customer behavior, and measuring releases.
